check_snmp is odd when defining ranges for warning and critical - monitoring Domino Availability Index using Icinga 2

I am using Icinga 2 to monitor an IBM Domino server.
I have an Icinga Service configured to use check_snmp, monitoring the server availability index.
And I have finally understood how to properly configure the service to issue warnings and criticals based on a numeric return value.
The Domino SNMP oid for the Server Availability Index is 1.3.6.1.4.1.334.72.1.1.6.3.19.0
It will return a value between 0 and 100.
100 means that the server is doing fine handling its work.
I want my Icinga Service to issue warnings when the index is below 80.
And i want the Service to issue Criticals when the index is below 60.
The command line to test this looks like this:
/usr/lib64/nagios/plugins/check_snmp -H 192.168.0.59 -o 1.3.6.1.4.1.334.72.1.1.6.3.19.0 -w 80: -c 60:
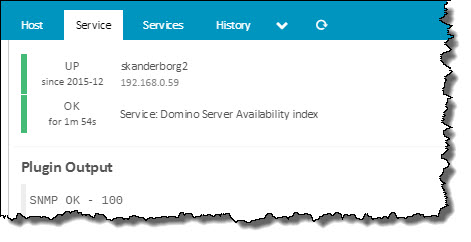
It will return something like this:
SNMP OK - 100 | iso.3.6.1.4.1.334.72.1.1.6.3.19.0=100;0;0;
100 here means we're doing fine.
Let's look at those -w and -c parameters.
I was lucky to find a page explaining how to use these: check_snmp
As the author says it:
you have to be aware that the ranges you put are the ones which do not trigger the warning or critical. (Which is ass-backwards IMO.)
In my service configuration file, here is how i put in the parameters:
apply Service "Domino Server Availability index" {
import "generic-service"
check_command = "snmp"
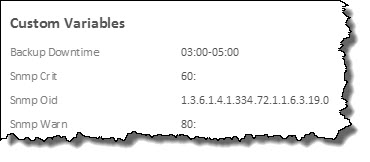
vars.snmp_oid = "1.3.6.1.4.1.334.72.1.1.6.3.19.0"
vars.snmp_warn = "80:"
vars.snmp_crit = "60:"
vars.backup_downtime = "03:00-05:00"
command_endpoint = host.vars.remote_client
assign where match("skanderborg2", host.name)
}
Here's output from the Icinga UI, showing the custom variables, read from the on-disk configuration: